Task #568
openInterpolation of temperatures in the Venezuela region
0%
Description
This issue pertains to the interpolation of temperature for the Venezuela region.
Files
Updated by Benoit Parmentier almost 12 years ago
- File LST_TMax_scatterplot_20100103_30_1_365d_GAM_fus5_all_lstd_02202013.png LST_TMax_scatterplot_20100103_30_1_365d_GAM_fus5_all_lstd_02202013.png added
- File Daily_tmax_monthly_TMax_scatterplot_20100103_30_1_365d_GAM_fus5_all_lstd_02202013.png Daily_tmax_monthly_TMax_scatterplot_20100103_30_1_365d_GAM_fus5_all_lstd_02202013.png added
This is the first plot: 
Updated by Benoit Parmentier almost 12 years ago
- File LST_TMax_scatterplot_20100103_30_1_365d_GAM_fus5_all_lstd_02202013.png LST_TMax_scatterplot_20100103_30_1_365d_GAM_fus5_all_lstd_02202013.png added
- File Daily_tmax_monthly_TMax_scatterplot_20100103_30_1_365d_GAM_fus5_all_lstd_02202013.png Daily_tmax_monthly_TMax_scatterplot_20100103_30_1_365d_GAM_fus5_all_lstd_02202013.png added
- File Predicted_tmax_versus_observed_scatterplot_20100103_30_1_365d_GAM_fus5_all_lstd_02202013.png Predicted_tmax_versus_observed_scatterplot_20100103_30_1_365d_GAM_fus5_all_lstd_02202013.png added
- File Raster_prediction_20100103_30_1_365d_GAM_fus5_all_lstd_02202013.png Raster_prediction_20100103_30_1_365d_GAM_fus5_all_lstd_02202013.png added
I completed the first run for prediction for year 2010 for the 6 tiles in Venezuela. I spent some time to check the results and revised the RMSE
presented during the IPLANT meeting.The code is currently working for GAM fusion with 9 models:
Mod1: y_var ~ s(elev_1)
Mod2: y_var ~ s(LST)
Mod3: y_var ~ s(elev_1 LST)
Mod4: y_var ~ s(lat) + s(lon)+ s(elev_1)
Mod5: y_var ~ s(lat,lon,elev_1)
Mod6: y_var ~ s(lat,lon) + s(elev_1) + s(N_w,E_w) + s(LST) ,
Mod7: y_var ~ s(lat,lon) + s(elev_1) + s(N_w,E_w) + s(LST) + s(LC2)
Mod8: y_var ~ s(lat,lon) + s(elev_1) + s(N_w,E_w) + s(LST) + s(LC6)
Mod9: y_var ~ s(lat,lon) + s(elev_1) + s(N_w,E_w) + s(LST) + s(DISTOC)
Mod_kr: kriging
Here are the first results for January 3, 2010:
Figure 1 shows the relation between TMax and LST.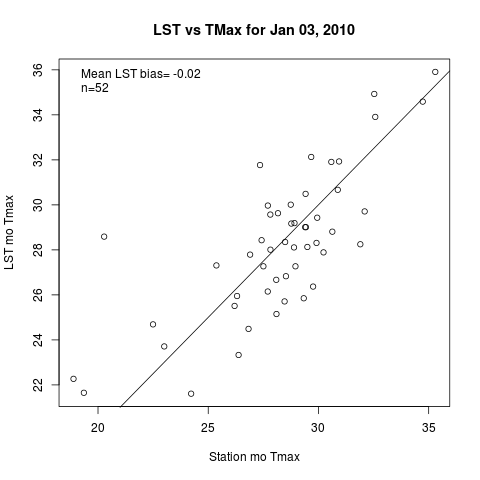 Note the low bias of -0.02 for January compared to -2.54C in Oregon.There are 52 observations available for the calculation of the bias surface.
Figure 2 displays the relation between dailyTmax and monthly TMax. 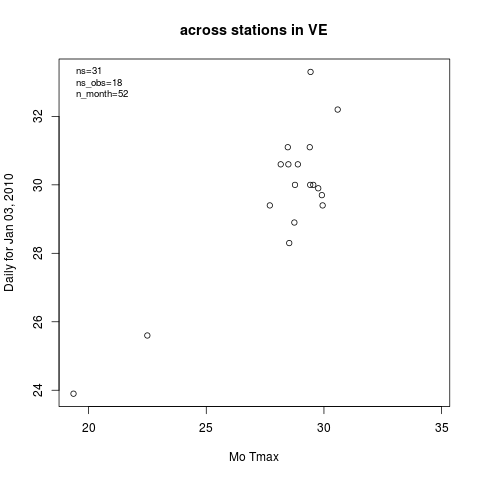 We have 31 training stations but only 18 with actual observations. Note that 13 stations were kept for the validation.
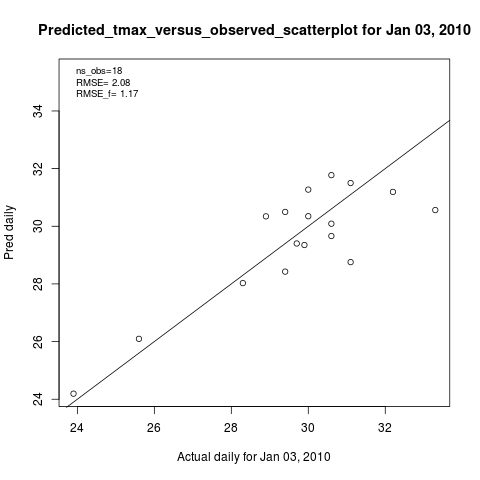
Figure 3 compares predicted and observed dailyTmax for Venezuela.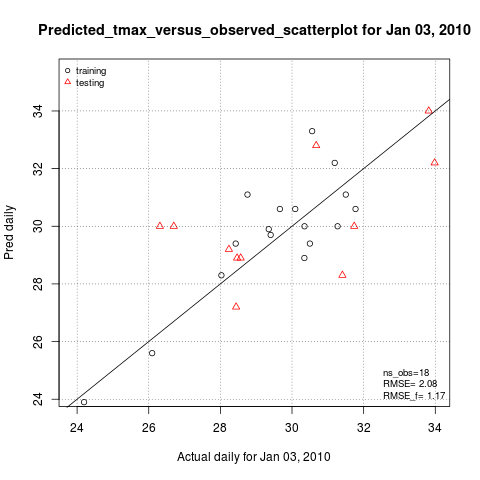
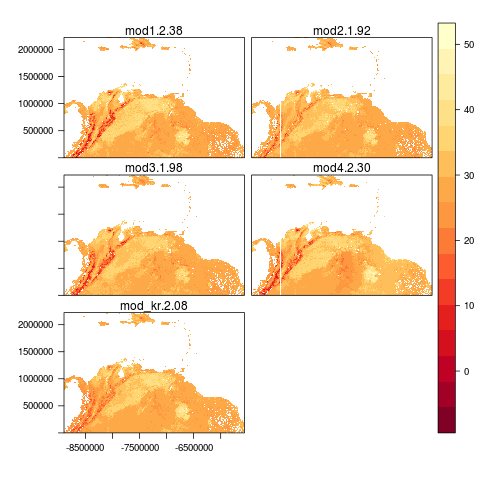
Figure 4 displays the interpolated maps for 5 models. There are no predictions for Model 5 to model 9.
This is because there are not enough observations to fit GAM models especially when there are interactive smooth terms.  RMSEs for each model are displayed on the top of the maps.DailyTmax show variations (from warm to cooler) in grass, forest and mountains areas.
Updated by Benoit Parmentier almost 12 years ago
- File Study_area__365d_GAM_fus5_all_lstd_02202013.png Study_area__365d_GAM_fus5_all_lstd_02202013.png added
I have now put together a short script that will be turned into a function to generate some useful output based on the raster prediction per date (see 03aa4873). Here are a few of the generated figures.
Study area
Updated by Benoit Parmentier almost 12 years ago
- File Study_area__365d_GAM_fus5_all_lstd_02202013.png Study_area__365d_GAM_fus5_all_lstd_02202013.png added
- File Monthly_data_study_area_365d_GAM_fus5_all_lstd_02202013.png Monthly_data_study_area_365d_GAM_fus5_all_lstd_02202013.png added
- File Training_testing_stations_map_20100103_30_1_365d_GAM_fus5_all_lstd_02202013.png Training_testing_stations_map_20100103_30_1_365d_GAM_fus5_all_lstd_02202013.png added
- File Predicted_tmax_versus_observed_scatterplot_20100103_30_1_365d_GAM_fus5_all_lstd_02202013.png Predicted_tmax_versus_observed_scatterplot_20100103_30_1_365d_GAM_fus5_all_lstd_02202013.png added
- File Bias_delta_surface_NA_NA_NA_365d_GAM_fus5_all_lstd_02202013.png Bias_delta_surface_NA_NA_NA_365d_GAM_fus5_all_lstd_02202013.png added
- File Raster_prediction_20100103_30_1_365d_GAM_fus5_all_lstd_02202013.png Raster_prediction_20100103_30_1_365d_GAM_fus5_all_lstd_02202013.png added
- File boxplot_metric_rmse_365d_GAM_fus5_all_lstd_02202013.png boxplot_metric_rmse_365d_GAM_fus5_all_lstd_02202013.png added
- File boxplot_metric_mae_365d_GAM_fus5_all_lstd_02202013.png boxplot_metric_mae_365d_GAM_fus5_all_lstd_02202013.png added
- File mean_and_median_values_dailyTmax_prediction_RMSE_MAE_year2010_VE.png mean_and_median_values_dailyTmax_prediction_RMSE_MAE_year2010_VE.png added
I have now put together a short script that will be turned into a function to generate some useful output based on the raster prediction per date (see 03aa4873). Here are a few of the generated figures.
Fig1:Study area Venezuela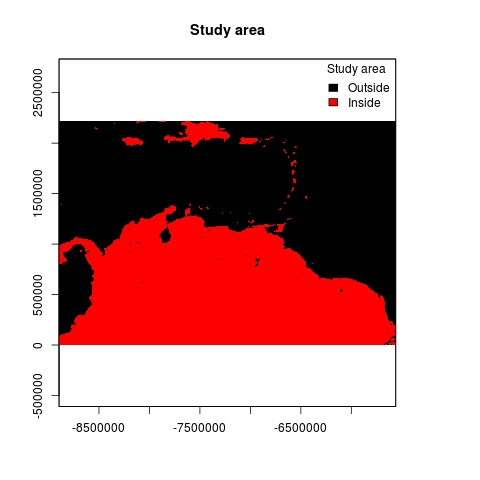
This figure is generated using land cover 12 (LC12: water) from the consensus product. There are some disagreeements in terms of how many pixels are valid among different inputs (LST, ELEV_SRTM etc.). According to LC12 mask There are 3,684,606 pixels that are land out of a total of 8,640,000. This means that about 42.65% of the image.
Fig2: Map of monthly ghcn stations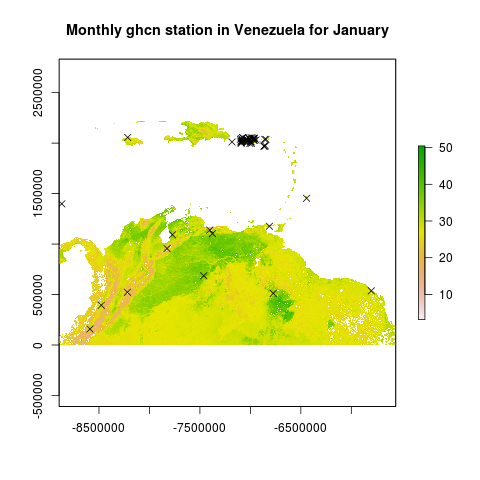
This is a map of the 52 ghcnd station with monthly TMAX averages. Thsi is for the month of January. The S flag was added to obtain more stations. The average is done over the 2000-2010 time period. I'll be doing the same thing using the 1980-2010 time period to get more data point for the GAM fitting.
Fig3: Map of training and testing stations-20100103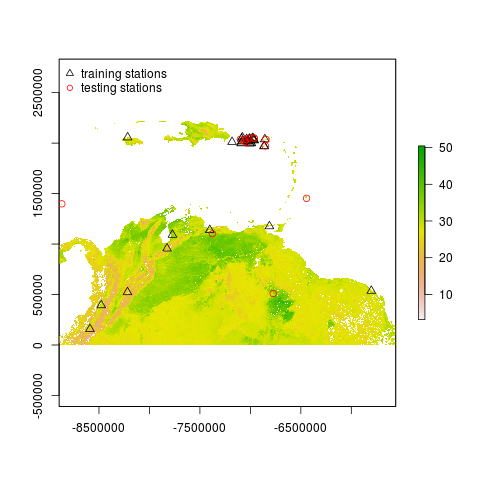
Testing (validation) stations are in red and training in black(triangles).
Fig4: Scatterplot tmax predicted and observed-20100103
This plot shows the predicted tmax for both testing and training sites. The RMSE is 2.08 for for GAM using kriging without covariates. Note that out of 31 stations, only 18 have valid TMAX daily information.
Fig5: Map of bias and delta surfaces for-20100103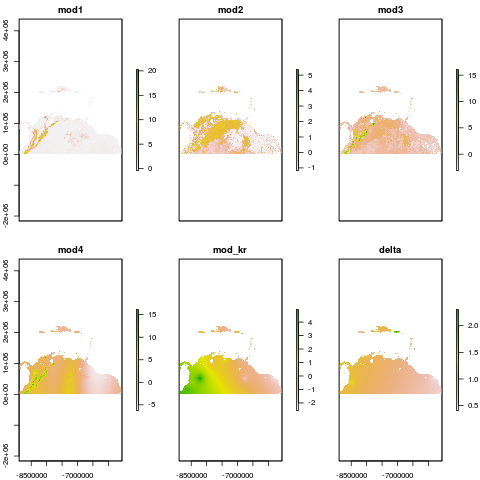
Fusion method: Bias surfaces are for January. There are 5 bias surfaces (see models used in previous update) predicted using GAM and covariates (with the exception of mod_kr using kriging). The delta surface is obtained through kriging.
Fig6: Map of bias and delta surfaces for-20100103
Fusion method: predicted tmax surfaces with RMSE. This is a repeat from last update. There are 5 predicted surfaces (see models used in previous update) for January 3, 2010.
Fig7: Daily tmax RMSE boxplot for year 2010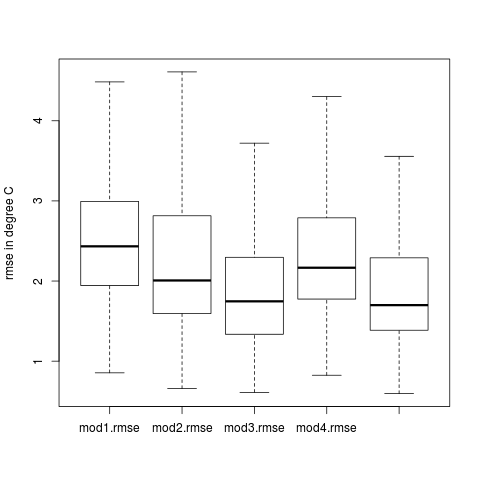
This is an output of the validation script(dc5bfc17). RMSEs are the lowest for model 3 (mean 2.04C)and mod_kr (mean 2.07C)last boxplot on the right). Model 3 includes LST and Elevation (s(LST,elev_1).
Fig8: Daily tmax MAE boxplot for year 2010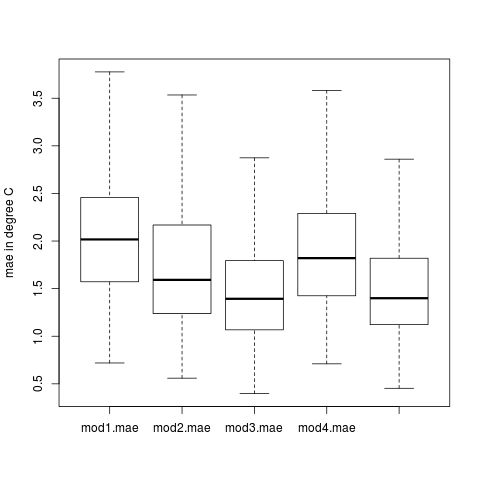
This is also an output of the validation script(dc5bfc17) showing the Mean Absolute Error (MAE) for the validation stations over 365 dates (year 2010). Results are similar to RMSEs i.e. mod3 and mod_kr have the lowest MAE with mean values of 1.56C and 1.58C respectively.
Mean and median values for validation metrics for year 2010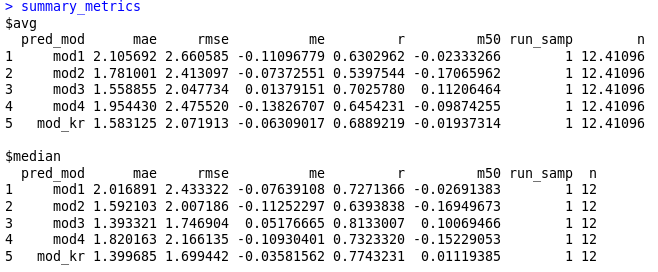
Here is the output for the mean and median values derived from the daily prediction of tmax for the Venezuela region.
Updated by Adam Wilson almost 12 years ago
I recently realized that the MOD35 Cloud Mask has a strong land-cover bias that affects the probability a pixel is considered cloudy over 'desert' ecosystems, where 'desert' is used quite broadly and includes much non-forest in the region. See issue 583 [[https://projects.nceas.ucsb.edu/nceas/issues/583]] for details. This will affect most MODIS products, including the MOD11 LST data and from the broad scale images above, I think it may be something we need to consider.